Monday, 9 October 2017

USD may not extend its downtrend since early 2017. Sell EUR/USD?
The Fed could act more hawkish as what investors are expecting now
In our “Weekly Market Report” last week, we mentioned “Why Dollar Bull Is Likely to Run Out of Stream” even as Trump proposed the tax reform plan in detail. The Dollar’s trading pattern was in a range last week. We do not see a substantial dollar rebound in the final quarter of the year. However, in this report, we will explain why you should not sell US dollar consistently, even after poor payroll numbers reported last Friday.
The Dollar index had been falling in the last three consecutive quarters. Wall Street has a good saying: “Trend is your best friend”. We think applying this rule on the dollar in this quarter carries tremendous risk, and here are five reasons why.

Reason #1: Don’t focus too much on NFP, watch the unemployment rate as well
Nonfarm payroll employment decreased 33,000 in September, the first contraction in seven years. Data showed sharp employment decline in food & beverages services and below-trend growth in some other industries.  This reflected the impact of Hurricanes Irma and Harvey. Such outcome showed weak NFP don’t reflect the economic fundamentals and the Fed has no reason to set policy outlook based on the payroll numbers this month.
The unemployment rate in September declined to 4.2%, lowest level since 2001. It is worth taking a look. With the unemployment rate heading towards 4% and probably falling below, the Fed must respond to “very tight” US labour market by gradually raising interest rates or risk halting the economic recovery. Prudent risk management would argue for continued gradual removal of monetary policy accommodation, in order to minimise the risk of shortening the current economic recovery prematurely.
Thus, market will start to gauge and price in the number of Fed hikes in 2018 in the coming months. This is likely to be dollar positive.

Reason #2: Weak dollar has benefitted the labour condition in US manufacturing sectors, better corporate profits mean a better US economy
Ignoring the latest payroll report, US manufacturing payroll had been improving in the past 12 months, thanks to the weak dollar. Soft dollar lifted the manufacturing companies’ profit, suggested a more solid US economy. Improving profitability in US companies echoed the current uptrend in its stock market, which should be positive to US dollar.

Reason #3: The Fed could be more hawkish than you are expecting, Yellen’s behaviour could be a “good message”
Yellen’s term as the Fed president could end by next February. In recent weeks, Yellen kept emphasising the importance of containing financial risks, suggesting the rate hikes will continue despite the below-target inflation data. As we know, rising interest rates would obstruct Trump’s economic plan in two crucial ways: higher interest to pay and collapse of the stock market.
Do not let this mislead you. This is about economics, not politics. Our best guess is Trump’s economic reform agenda may gradually kick off in 2018, including the recent proposal of tax reform. If so, the Fed will do its best to contain the financial risk, otherwise bubbles will be created in the various US financial sectors.

Reason #4: “ECB play” positions are exhausting
Let’s face one reality; USD weakness in earlier months was mainly driven by euro strength. Now there are less investors believing ECB is in a rush to tighten their monetary policy. Many of the traders started to close earlier “long euro” positions. After EUR/USD broke above 1.20 last month, the pair fell back quickly below 1.20. Such price reaction suggested there were not much interest in the market to purchase EUR/USD when it is above 1.20, before Mario Draghi makes clear the timeline of its QE tapering.

Reason #5:US Treasuries’ largest foreign holders may continue buying towards year-end
After Chinese yuan has stabilised this year, nation’s capital outflow pressure is mitigated. Two reasons may drive Chinese central bank to buy US Treasuries, which is equal to buy the dollar in near term. First, PBOC looks keen to defend its FX reserves at USD 3 trillion level. Second, PBOC may not be comfortable with its currency rising too quickly.

Our Picks
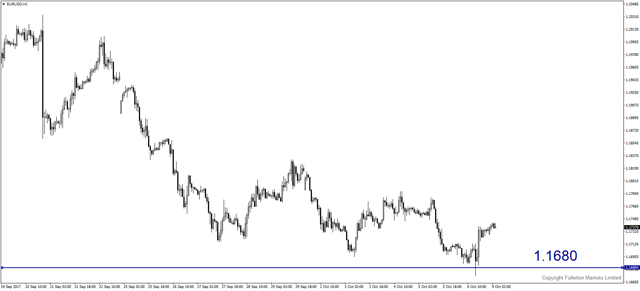
EUR/USD – Slightly bearish.
This pair may fall towards 1.1680. US CPI may offer support to the dollar this week. 
 eurusd-h1-fullerton-markets-limited.png

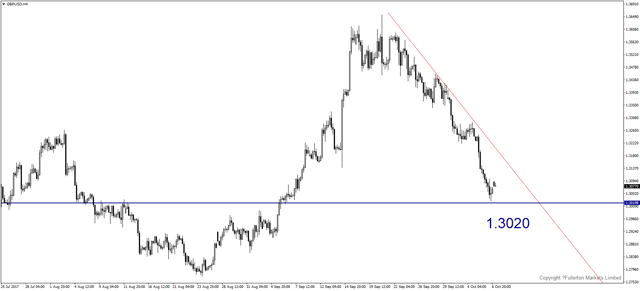
GBP/USD – Slightly bearish.
H4 chart is showing downtrend since middle of last month. This pair may test 1.3020. 
 gbpusd-h4-fullerton-markets-limited.png

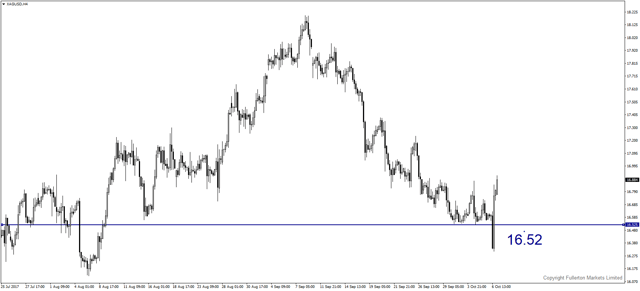
XAG/USD (Silver) – Slightly bearish.
We expect price to drop towards 16.52. 
xagusd-h4-fullerton-markets-limited-2.png

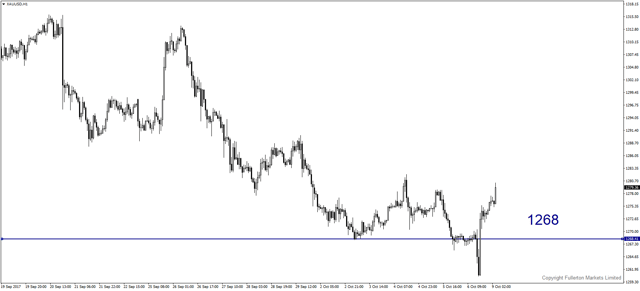
XAU/USD (Gold) – Slightly bearish.
We expect price to fall towards 1268. 
 xauusd-h1-fullerton-markets-limited.png

Top News This Week (GMT+8 time zone)
UK: Manufacturing Production MoM. Tuesday 10th October, 4.30pm.
We expect figures to come in at 0.3% (previous figure was 0.2%).
US: CPI YoY.  Friday 13th October, 8.30pm.
We expect figures to come in at 2.1% (previous figure was 1.9%). 

Friday, 6 October 2017


Inside Bar Forex Trading Entry
Inside bars are one of my favorite price action setups to trade with; they are a high-probability trading strategy that provides traders with a good risk reward ratio since they typically require smaller stop losses than other setups. I like to trade inside bars on the daily chart time frame and ideally in strong trending markets, as I have found over the years that inside bars are best in trending markets as breakout plays in the direction of the trend. However, they can indeed also be used as reversal signals from key chart levels, we will discuss both in this tutorial. Let’s discuss some facts about inside bars first and then I will go over some examples of how I like to trade them.

What is an inside bar?

An inside bar is a bar (or a series of bars) that is completely contained within the range of the preceding bar, also known as the “mother bar”. The inside bar should have a higher low and lower high than the mother bar (some traders use a more lenient definition of inside bars to include equal bars). On a smaller time frame such as a 1 hour chart, a daily chart inside bar will sometimes look like a triangle pattern.
Important note: Since the inside bar setup is by its very nature a potential breakout signal, I ONLY enter an inside bar on a breakout of the mother bar high or low. If I am looking to buy, I will place a buy on stop entry just above the mother bar high, and if I am looking to sell I will place a sell on stop entry just below the mother bar low.
There are different variations, but the way I determine an inside bar setup is if the inside bar is contained within the range of the mother bar from high to low. That is to say, I use the mother bar high and low to define the range that the inside bar can be contained within, others might use only the real body of the mother candle as the determining range, but I do not teach or trade it that way.
In the example image below, we can see the anatomy of an inside bar setup. Note that the inside bar is fully contained within the range of the high and low of the mother bar. You can have multiple inside bars within the range of one mother bar. If you see a pattern of consecutive inside bars that are “coiling” and all within the previous bar’s range, this can signal that a powerful breakout might be coming, more on this later.

What does an inside bar mean?

The inside bar forex trading strategy is a ‘flashing light’, a major signal to the trader that reversal or continuation is about to occur.
An inside bar indicates a time of indecision or consolidation. Inside bars typically occur as a market consolidates after making a large directional move, they can also occur at turning points in a market and at key decision points like major support/resistance levels.
They often provide a low-risk place to enter a trade or a logical exit point. In the image you will see next, we see an example of inside bars that formed as a continuation signals and then one that formed as a turning point signal. While they can be used in both scenarios, inside bars as continuation signals are more reliable and easier for beginning traders to learn. Turning-point, or inside bar reversal signals, are best to leave alone until you have some solid experience under your belt as a forex price action trader.

How to trade the inside bar setup

There are basically two ways to trade an inside bar setup: As a continuation signal or as a reversal signal.
The chart image below has a variety of inside bars for us to pick apart…
First, you will see that we have inside bars that acted as continuation signals, that is they resulted in a continuation of the previous momentum before their formation. These continuation inside bars often result in nice breakouts in-line with the current trend and near-term momentum.
We can also see a good example of an inside bar that acted as a reversal or turning point signal. Note on the far right side of the chart an inside bar formed at a key support level, the market then broke back the other direction and made a nice move higher from the inside bar / stalling pattern that formed at a previous level of key support.
how to trade inside bars
Important note: There are basically two different stop loss placements for inside bar setups, and you will have to use some discretion in determining the best one for each inside bar you trade.
The “classic” and most commonly used stop loss placement will be just above or below the mother bar high or low, depending on if you are trading long or short of course. I typically go with 1 pip above or below the mother bar high or low…no need to try and figure out the “best” distance above or below the mother bar…the trade either works or it doesn’t, a few pips won’t make that big a difference over the long-run.
The next stop placement is typically used on inside bars with larger mother bars. Although a larger mother bar on an inside bar setup is not really what I like to see, you can sometimes trade inside bars with larger mother bars, and if you do, you will probably want to place your stop loss near the mother bar 50% level, that is the ‘halfway point’ between the high and low of the mother bar, as that is really the only way to get a decent risk reward ratio on these types of inside bar setups.
I prefer smaller and “tighter” inside bars that don’t have really large mother bars…this shows more ‘compression’ and thus a stronger potential breakout from that compression. If you are a beginner or struggling trader, I suggest you avoid inside bars with big mother bars for now, see the previous example chart above for an example of an inside bar with a big mother bar.
Inside bars as continuation signals
The most logical time to use an inside bar is when a strong trend is in progress or the market has clearly been moving in one direction and then decides to pause for a short time.
Inside bars can be used when trading a trend on the 4 hour charts or the daily charts, but I personally prefer to trade inside bars on the daily charts and I recommend all beginning traders stick to the daily charts and until they have fully mastered and found consistent success with the inside bar setup on that time frame. I also recommend sticking to inside bars that are in-line with the daily chart trend as continuation signals until you have fully mastered trading them that way.
In the chart example below, we can see a few examples of inside bar setups on the daily EURUSD chart that worked out quite nicely. They were in-line with the near-term dominant daily chart trend and resulted in nice breakout continuation plays…
trading inside bars in trends
Inside bars as reversal signals
You can sometimes trade inside bars as reversal signals from key chart levels. Please note that this should ONLY be tried after you have successfully mastered trading inside bars in-line with the daily chart trend as continuation / breakout plays, as we discussed above.
In the chart below, we can see an example of a good inside bar reversal signal. Of critical importance here, is that the inside bar formed at a key chart level, indicating the market was hesitating and “unsure” if it wanted to move any higher. We can see a decent downside move occurred as price broke down past the inside bar’s mother bar low..
inside bars as reversal signals

The best time frame for trading inside bars

I really only trade inside bars on the daily chart time frame. There’s good reason for this, and that reason is mainly because on time frames under the daily chart, inside bars simply grow too numerous to be worth trading. There can be long strings of inside bars on a 4 hour or 1 hour chart before a breakout for example, and trying to trade them will most likely cause you a lot of frustration due to all the false breaks that can occur on those chart time frames.
I get a lot of emails about inside bars, and many traders try in vain to trade them on lower time frame charts, and it really is just a huge waste of time. Once you gain experience, you MIGHT be able to trade inside bars on a 4 hour chart time frame, but that is the LOWEST time frame I would ever consider trading an inside bar on. The daily chart is the best for inside bars, and even the weekly chart can sometimes yield some very lucrative inside bar setups.
Inside bars can be used when trading a trend on the 240 minute charts or the daily forex charts, but I personally prefer to trade inside bars on the daily charts and I recommend all beginning traders should stick to the daily charts until they have fully mastered and found consistent success with the inside bar setup on that time frame.
In the chart example below, note how well the inside bars highlighted worked out. They won’t all work out obviously, but inside bars on the daily chart have a much higher probability of bringing you a profit than an inside bar on a lower time frame…
inside bars on daily chart
The chart example below shows a recent 1 hour chart of the EURJPY. If you look closely you will see A LOT of inside bars that failed, this is a prime example of why I avoid trading inside bars on the 1 hour chart and also why I LOVE to trade them on the daily chart time frame…
inside bars 1hour chart
author thumb
 By  in Forex Trading Strategies Last updated on  | 

Thursday, 5 October 2017

Negative expectations on jobs data may limit dollar’s downside, sell gold?
Nearly no one is expecting a decent nonfarm payroll data for September due to bad weather in US. In other words, dollar selling after data are released could be very short-lived. However, if data surprise to the upside, dollar could spike.

  • Data to be released this Friday, 8.30pm Beijing/HK time. Economists expect the figure to be at 82k only, due to bad weather condition.
  • However, both ISM manufacturing and service PMIs in September suggested the economic activities were active. Manufacturing PMI rose to 60.8 versus previous 58.8, and service PMI jumped to 59.8 from 55.3.
  • Both data suggested the pace of hiring in the largest economy was not slowing down much.
  • Possibility on Fed to raise rate in December rose to 79.2%, according to CME FedWatch tool.
  • If NFP is above 90k, we think dollar could climb on a surprising outcome. If NFP is below 90k, we expect dollar may fall initially, but price could recover quickly as Fed is not expected to take this data into its policy consideration.
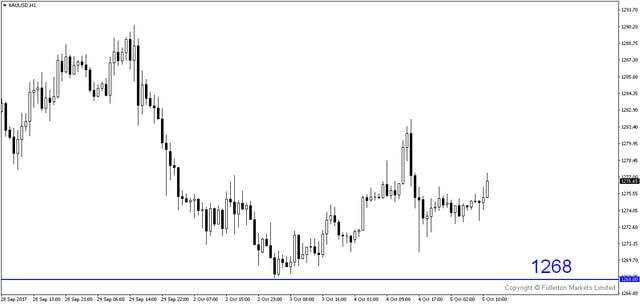
  • Potential dollar rise means gold to fall. We expect gold price may fall towards 1268 after NFP.
 
XAUUSDH1.png


Trump’s tax reform that boost dollar seems to be short-lived, sell USD/JPY?
Trump sold tax reform plan that calls for sweeping tax cuts and a simplification of the tax code
US dollar strength could return in the fourth quarter as President Trump finally unveiled his tax reform plan, but the strength could just stay for weeks or months. We think the tax cut is not likely to be substantial enough to lift the consumption. Fed’s unwinding and its rates’ setting will be the driver for dollar’s long-term trend.
US President Trump last week unveiled the Republican framework for tax reform that calls for sweeping tax cuts and a simplification of the tax code, while some details remained to be filled in. The framework would reduce the top corporate tax rate from 35% to 20% and individual tax rate from 39.6% to 25%. No details of the plan have been offered, including the elimination of taxes on large inheritances and deep reductions in the rates paid by large and small businesses.
According to analysis issued last Friday by the Tax Policy Centre, Trump/GOP plan would actually increase taxes on non-business individual income by $470 billion, while reducing taxes on business income by $2.6 trillion over the next decade. In other words, highly paid employees are the big losers. This piece of estimate offered an important clue to the market: this round of dollar rally may not be sustainable. US corporate earnings and business sentiments have been substantially improved in past 12 months, with nation’s unemployment rate continued to fall to new lows. However, improving corporate earnings and labour market conditions failed to boost the consumption. Inflation of the world’s largest economy remained subdued and showed no sign of reaching Fed’s target at 2%. Personal consumption is a key factor driving the pace of Fed’s rates setting. US Treasury market looked calm on the tax reform news. Front-end of the US curve was steady, with 7-10y sector underperforming as yields gained 1-1.5bps.
In conclusion, we think markets’ focus in the long run will be on Fed’s plan. Its balance-sheet runoff may mean greater volatility and higher yields over the next few years.  These could mean more room for the safe assets like yen and gold to rise, pressuring dollar lower.
NOTE: Trading volumes are very low these days as financial markets in India, South Korea and Hong Kong are closed today for holiday, and Chinese market is closed for the entire week.

Our Picks
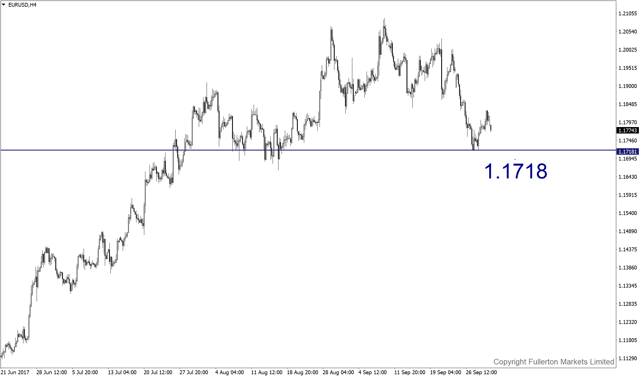
EUR/USD – Slightly bearish.
This pair may fall towards 1.1718 this week, as investors react to the clashes in Spain over a banned Catalonian independence referendum. 
 eurusd-h4-fullerton-markets-limited.png

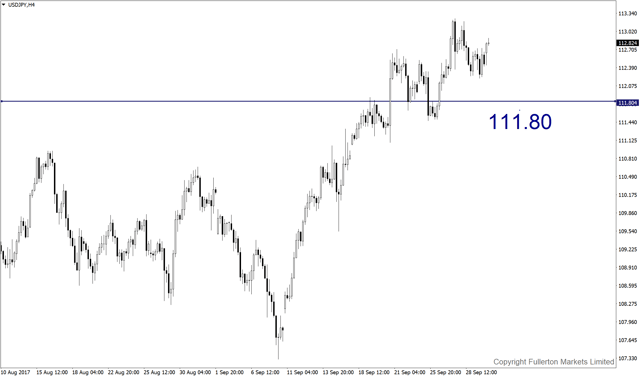
USD/JPY – Slightly bearish.
Possibility of US stocks to consolidate may drive demand on yen. This pair may dip towards 111.80. 
 usdjpy-h4-fullerton-markets-limited-2.png

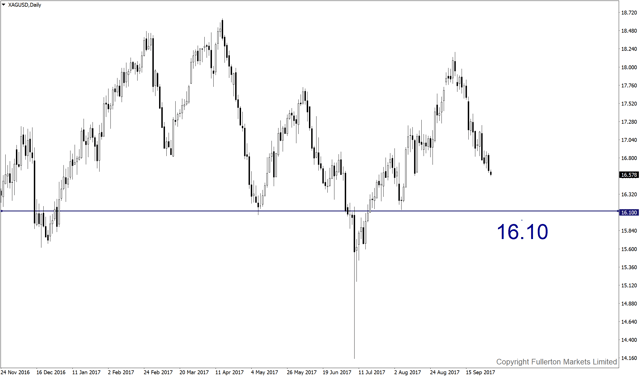
XAG/USD (Silver) – Slightly bearish.
We expect price to drop towards 16.10 this week. 
 xagusd-d1-fullerton-markets-limited.png

XAU/USD (Gold) – Slightly bearish.
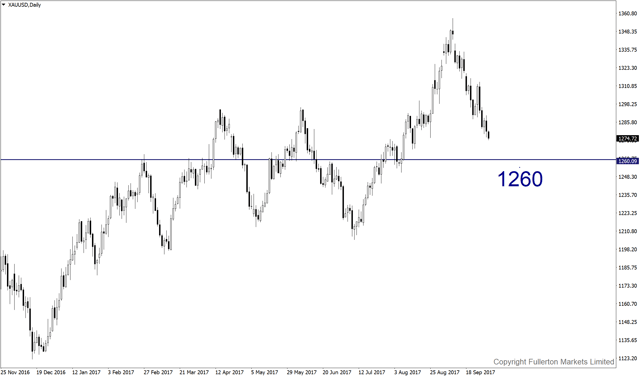
We expect price to fall towards 1260 this week. 
 xauusd-d1-fullerton-markets-limited.png

Top News This Week (GMT+8 time zone)
Australia: RBA rate decision. Tuesday 3rd October, 11.30am.
We expect figures to remain unchanged at 1.50%.
US: Nonfarm payrolls. Friday 6th October, 8.30pm.
We expect figures to come in at 95k (previous figure was 156k).

Sunday, 1 October 2017

The text here is primarily from Dr Alexander Elder's monumental book, "Trading For A Living" . I added in some of my own to give it a nice Forex Twist!
Each price is the momentary consensus of value of all market participants. When bulls feel strongly bullish, they buy more eagerly and push markets up. When bears feel strongly bearish, they sell more actively and push markets down.
Each price reflects action or lack of action by all traders in the market. Charts are a window into mass psychology. When you analyse charts, you analyse the behaviour of traders.
Ask most traders why prices go up, and you are likely to get this answer: more buyers than sellers. This is NOT true. The number of contracts bought and sold in ANY market is ALWAYS EQUAL.
If you want to buy a contract of Swiss Francs, someone has to sell it to you. If you want to sell a contract of Japanese Yen, someone has to buy it from you. This means that the number of long and short positions in the market is always equal.
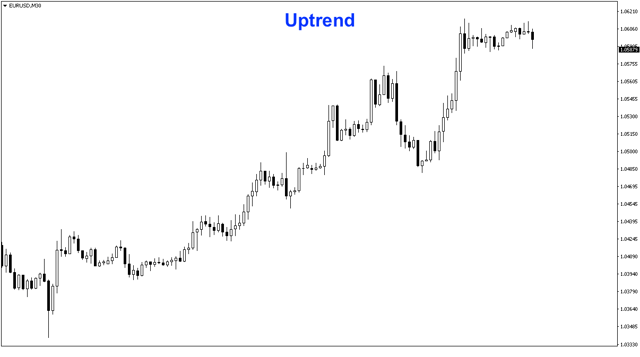
Prices move up or down because of changes in the INTENSITY of greed and fear among buyers or sellers. When the trend is up, bulls feel optimistic and do not mind paying a little extra. They buy high because they expect prices to rise even higher. Bears feel tense in an uptrend, and they agree to sell only at a higher price.
up_trend.png
When greedy and optimistic bulls meet fearful and defensive bears, the market rallies. The stronger their feelings, the sharper the rally. The rally ends only when many bulls lose their enthusiasm. When prices slide, bears feel optimistic and do not quibble about selling short at lower prices.
Bulls are fearful and agree to buy only at a discount. As long as bears feel like winners, they continue to sell at lower prices, and the downtrend continues. It ends when bears start feeling cautious and refuse to sell at lower prices.
Few traders act as purely rational human beings. Most market participants act on the principle of "monkey see, monkey do." The waves of fear and greed sweep up bulls and bears. Markets rise because of greed among buyers and fear among sellers.
Bulls normally like to buy on the cheap. When they turn very bullish, they become more concerned with not missing the rally than with getting a cheap price. A rally continues as long as bulls are greedy enough to meet sellers' demands.
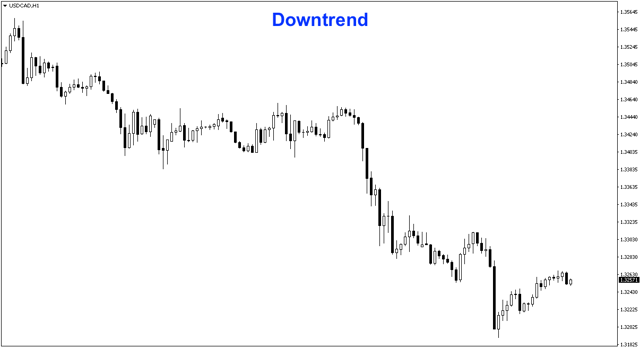
Markets fall because of greed among bears and fear among bulls. Fearful buyers agree to buy only below the market. As long as sellers are willing to meet those demands, the decline continues.
down_trend.png
Either way, you need to base your trades on a carefully prepared trading plan and not jump in response to price changes. It pays to write down your plan. You need to know exactly under what conditions you will enter and exit a trade.
Do not make decisions on the spur of the moment - this is when you are most vulnerable to being sucked into the crowd.

Monday, 25 September 2017

Fed’s balance sheet unwinding may hurt sentiments on stocks. Good opportunity to buy gold?
Fed’s downgrade on its long-term target rate to flatten yield curve, which is seen as negative to dollar
Fed appeared to be hawkish in its FOMC September meeting. Not only did they offer the timetable for its balance sheet unwinding, but also outlined another 3-4 interest rate hikes by end of next year. But we must take note Fed downgraded its long-term Fed fund rate target by 25bps, such move immediately flattened US Treasury yield curve. A flattening yield curve could be negative to the currency. Despite dollar moving higher after FOMC meeting, we saw that as a knee-jerk reaction, instead of a sustainable move.
Fed held benchmark interest rate unchanged as expected last week.  Fed confirmed they will start to unwind its balance sheet in October, as recent hurricanes may not have a long-term impact on the economy in their view. At the same time, Fed raised the growth forecast to 2.4% from previous 2.2% this year, but lowered the core inflation forecast to 1.5% from 1.7%. What Fed foresees its economy outlook to be is like ECB: a higher growth with a slower inflation outlook.
In general, Fed’s statement looked hawkish. According to textbook rule, investors should buy the currency when its central bank seeks to tighten the monetary policy. However, it could be different this time. As mentioned above, Fed downgraded its long-term Fed fund rate target by 25bps to 2.75%. Why Fed did that? We think the reason behind the curtain is because Fed doesn’t want to see the curve steepen too much. A few years ago, Fed expected the peak rate at 4.25% in current tightening cycle.
Despite Fed “saying” they are going to tighten for at least next 15 months, rates market seemed not buying that story. After FOMC meeting, 2-30 Treasuries yield spread narrowed to 136 bps, the least since June; while 5-30s’ spread narrowed to 93 bps, the least since July. Hence we can almost conclude the rates market was paying more attention to Fed’s outlook on its mid-long term interest rate than the pace of tightening. If market starts to increase the portfolio on long tenors’ US Treasuries, the depressing curve could pressure dollar lower, especially when euro zone and UK’s yields are likely to edge higher as ECB and BOE looked ready to tighten.
We still view Fed’s current tightening cycle is reaching a mature stage, even as it is still looking forward to hiking rates in 2018. Historical data showed each Fed’s tightening cycle was around two years, with only one exception in 1976, which lasted for four years. In other words, current tightening cycle started from 2015 could be reaching a mature stage.
No matter how skillful Fed’s communication is, the path of unwinding the balance sheet cannot avoid an increasing volatility in capital market, due to its unknown impact to the economy. In other words, VIX is set to rise from the current historical level. Investors could seek safe-haven assets such as gold, US Treasuries and Japanese yen.

Our Picks
NZD/USD – Slightly bearish.
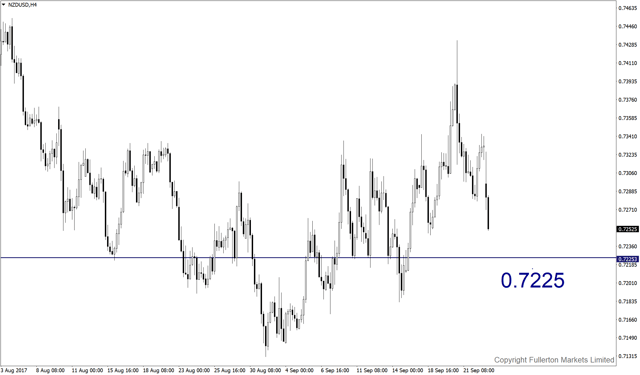
This pair may drop further towards 0.7225 amid political uncertainties after the election. 
 nzdusd-h4-fullerton-markets-limited.png

USD/JPY – Slightly bearish.
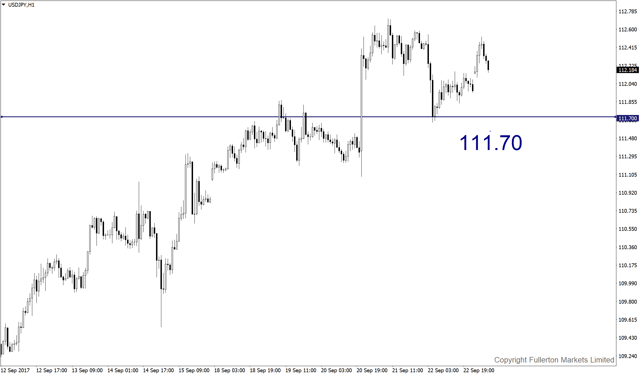
Fed’s unwinding may spur some flows into safe-haven assets. This pair may dip towards 111.70. 
 usdjpy-h1-fullerton-markets-limited.png

XAG/USD (Silver) – Slightly bullish.
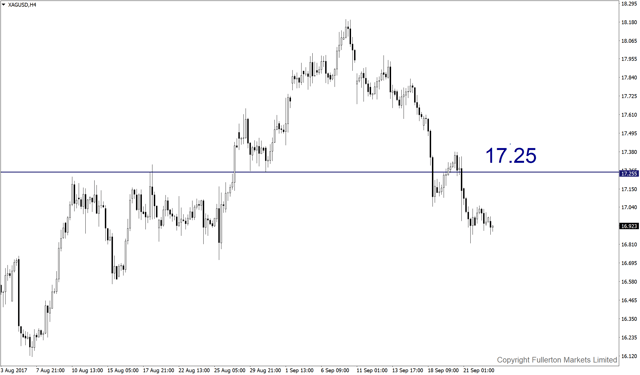
We expect price to rise towards 17.25 this week. 
 xagusd-h4-fullerton-markets-limited.png

XAU/USD (Gold) – Slightly bullish.
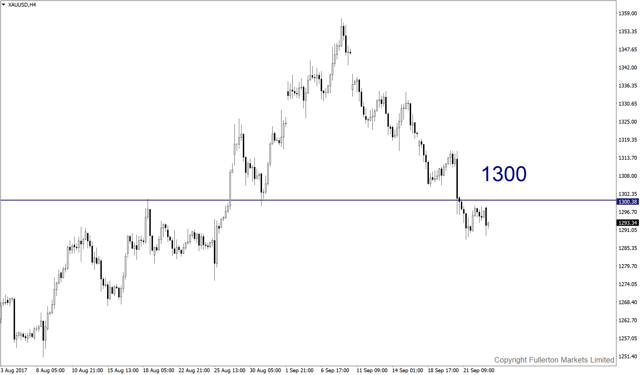
We expect price to rise towards 1300 this week.
 xauusd-h4-fullerton-markets-limited.png

Top News This Week (GMT+8 time zone)
New Zealand: RBNZ rate decision. Thursday 28th September, 4am.
We expect figures to remain unchanged at 1.75%.
Euro Zone: CPI y/y. Friday 29th September, 5pm.
We expect figures to come in at 1.3% (previous figure was 1.2%).

Saturday, 23 September 2017

While gold is always regarded as the most precious metal, the importance and value of silver cannot be neglected. Silver is a fascinating metal that has been part of our history and even some religious rites. Silver is more than just a fancy flatware or jewellery. In fact, silver is used in various industries including industrial, electrical, dentistry and medicine and is also a widely traded commodity.

Below are some interesting facts about silver you might not know.
  1. Silver was the first metal to be used as currency, more than 4,000 years ago.
  1. In ancient Egypt, Silver was valued higher than gold. It was more rare than Gold at that time.
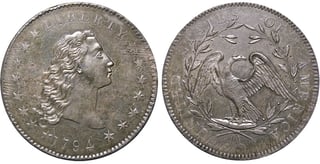
  1. The first Silver US dollar coin was minted in 1794.
 
5.jpg

  1. In 1904, there was an abundance of silver coins and silver mining had slowed down, so production was ceased till 1921.
  1. The word "Silver" originates from the English Anglo-Saxon word "seolfor".
  1. "Silver" means "money" in more than 14 different languages including French, Thai, Swahili, and Welsh.
  1. Silver is the best conductor of heat and electricity. Definitely one of the very valuable elements on earth.
 
4.jpg
  1. The biggest producer of Silver is Mexico and the biggest buyer of Silver is United States of America (as of 2016).
    6.jpg
  2. The global Silver reserves amount to around 530,000 tonnes, about 3 times more than that of Gold.
  1. The modern Olympic Gold Medal is made of Sterling Silver, which is then plated with 6 grams of pure gold.
1.png

Affiliate Account

DEPOSIT/WITHDRAW

RM 4.40/RM 4.20

TOTAL DEPOSIT

106.37 USD

TOTAL WITHDRAW

126.7 USD

TOTAL EARNED

7.57 USD

Join Fullerton Market

Join FBS

Leave Your Question Here

Popular Posts

Blog Archive

Like Our Fan Page

Live Traffic Feed

Bitcoin Core

Bitcoin Cash

DogeCoin

LiteCoin

Dash